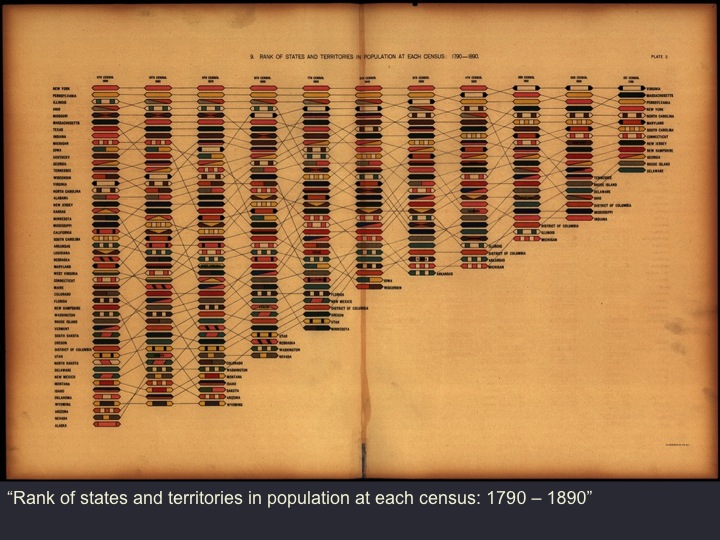
Just over a hundred years ago, in 1898, Henry Gannett published the second of what would become three illustrated Statistical Atlases of the United States. Based on the results of the Census of 1890– and I note, if only to make myself feel a little better about the slow pace of academic publishing today, eight years after the census was first compiled– Gannett, working with what he openly acknowledged as a team of “many men and many minds,” developed an array of new visual forms to convey the results of the eleventh census to the US public.
The first Statistical Atlas, published a decade prior, was conceived in large part to mark the centennial anniversary of the nation’s founding. That volume was designed to show the nation’s territorial expansion, its economic development, its cultural advancement, and social progress. But Gannett, with the centennial receding from view, understood the goal of the second atlas in more disciplinary terms: to “fulfill its mission in popularizing and extending the study of statistics.”
It’s not too much of a stretch, I think, to say that we’re at a similar place in the field of DH today.
Continue reading at Talk at Digital Humanities 2014.
