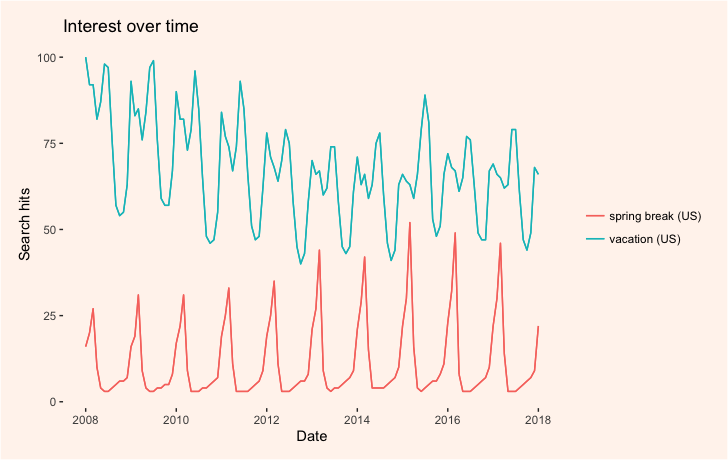
This is a quick introduction on how to get and visualize Google search data with both time and geographical components using the R packages gtrendsR, maps and ggplot2. In this example, we will look at search interest for named hurricanes that hit the U.S. mainland and then plot how often different states search for “guns.”
