I’m venturing into the world of open-source by releasing a program I used in a recent research project.
The program tries to tackle one of the fundamental problem facing many digital humanists who analyze text: the gap between manual “close reading” and computational “distant reading.” In my case, I was trying to study the geography within a large corpus of nineteenth-century Texas newspapers. First I wrote Python scripts to extract place-names from the papers and calculate their frequencies. Although I had some success with this approach, I still ran into the all-too-familiar limit of historical sources: their messiness. Namely, nineteenth-century newspapers are extremely challenging to translate into machine-readable text. When performing Optical Character Recognition (OCR), the smorgasbord nature of newspapers poses real problems. Inconsistent column widths, a potpourri of advertisements, vast disparities in text size and layout, stories running from one page to another – the challenges go on and on and on. Consequently, extracting the word “Havana” from OCR’d text is not terribly difficult, but writing a program that identifies whether it occurs in a news story versus an advertisement is much harder. Given the quality of the OCR’d text in my particular corpus, deriving this kind of context proved next-to-impossible.
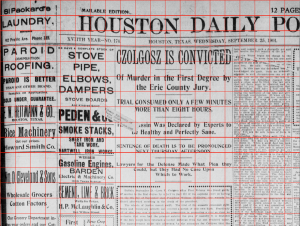
The messy nature of digitized sources illustrates a broader criticism I’ve heard of computational distant reading: that it is too empirical, too precise, and too neat. Messiness, after all, is the coin of the realm in the humanities – we revel in things like context, subtlety, perspective, and interpretation. Computers are good at generating numbers, but not so good at generating all that other stuff. My computer program could tell me precisely how many times “Chicago” was printed in every issue of every newspaper in my corpus. What it couldn’t tell me was the context in which it occurred. Was it more likely to appear in commercial news? Political stories? Classified ads? Although I could read a sample of newspapers and manually track these geographic patterns, even this task proved daunting: the average issue contained close to one thousand place-names and stretched more than 67,000 words (or, longer than Mrs. Dalloway, Fahrenheit 451, and All Quiet on the Western Front). I needed a middle ground. I decided to move backwards, from the machine-readable text of the papers to the images of the newspapers themselves. What if I could broadly categorize each column of text according both to its geography (local, regional, national, etc.) and its type of content (news, editorial, advertisement, etc.)? I settled on the idea of overlaying a grid onto the page image. A human reader could visually skim across the page and select cells in the grid to block off each chunk of content, whether it was a news column or a political cartoon or a classified ad. Once the grid was divided up into blocks, the reader could easily calculate the proportions of each kind of content.
My collaborator, Bridget Baird, used the open-source programming language Processing to develop a visual interface to do just that. We wrote a program called ImageGrid that overlaid a grid onto an image, with each cell in the grid containing attributes. This “middle-reading” approach allowed me a new access point into the meaning and context of the paper’s geography without laboriously reading every word of every page. A news story on the debate in Congress over the Spanish-American War could be categorized primarily as “News” and secondarily as both “National” and “International” geography. By repeating this process across a random sample of issues, I began to find spatial patterns.


