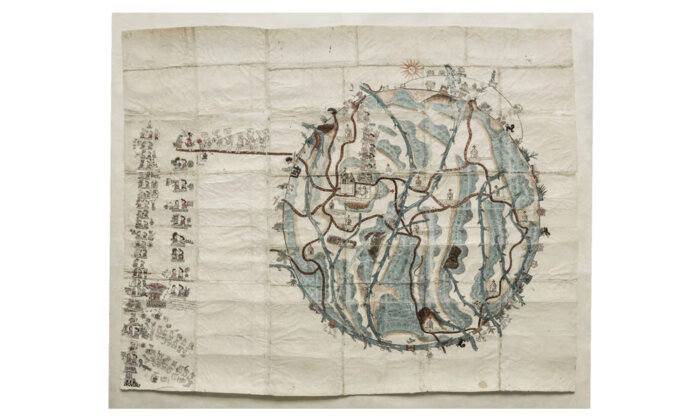
Our take: In this post, Lauren Klein uses the “Mapa de Teozacoalco” as a lens to discuss the importance and pervasiveness of data visualization. This map, of what is today the Mexican state of Oaxaca, was constructed for the King of Spain in 1580 in the hopes “that by visualizing the region’s complex terrain, he would gain immediate insight into the land over which he sought to rule.” She argues that data visualization is a tremendous form of power. This post points to how the simplicity of visualizations is both appealing and dangerous, as visualizations can mask their own complexity. No data visualization simply represents the ways things are, and rather reflect a set of specific design decisions made by specific people, in specific places and times, and for specific purposes.
Editors’ Choice: A 1580 Map Shows Why Data Visualization Is Never Neutral