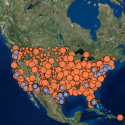
Torn Apart aggregates and cross-references publicly available data to visualize the geography of Donald Trump’s “zero tolerance” immigration policy in 2018 and immigration incarceration in the USA in general. We also draw attention to the landscapes, families, and communities riven by the massive web of immigrant detention in the United States.
Working nimbly and remotely from four sites in the United States over a six-day period, our small team of researchers set about identifying sources of data on immigrant detention, from ports of entry run by Customs and Border Protection (CBP), to Immigration and Customs Enforcement (ICE) detention centers, to shelters subcontracted by the Department of Health and Human Services’ Office of Refugee Resettlement (ORR) to care for children in their custody, to the financial trails left by a network of public, private, and non-profit organizations complicit with the complex infrastructure of immigrant detention in the United States.
Our sources for obtaining the data were varied. Those we worked from included a FOIA-ed list of ICE facilities, publicly available lists of CBP sites, data sets of ICE detainee hearings, state childcare licensing databases, government grant awards lists, and USASpending.gov. We cross-checked our data through non-governmental sources as well: news reports about immigrant detention, business databases, tax documents for non-profit organizations, job advertisements, Google Maps entries, Facebook Places, and more. All of our data has been verified through a minimum of two sources, at least one directly from the government.
What our data reveals is a shadowy network of government facilities, subcontractors from the prison-industrial complex, “non-profit” administrators paid over half a million dollars a year, and religious organizations across the country that, together, prop up the immigrant detention machine. Immigrant detention is a multi-billion dollar business and it’s happening in our own backyards. The crisis for immigrants in the United States is not only happening at the Mexico-United States border or other ports of entry. Rather, the border is everywhere.
This is not to say that Torn Apart, now in alpha release, paints a complete picture of immigrant detention. Like all maps, ours is a representation of data, reflecting choices we made while designing visualizations. For example, a simple decision to place data points in the foreground rather than in the background offers a very different reading of the locations of ICE detention centers, as the map below demonstrates.
Read more here.

